Tag Archives: kibana

Re-Index With Elasticsearch

Elasticsearch Logo

When dealing with indices, it’s inevitable there will be a need to change the mapped fields. For example, in a firewall log, due to default mappings, a field like “RepeatCount” was stored as text instead of integer. To fix this, first write an ingest pipeline (using Kibana) to convert the field from text to integer:

PUT _ingest/pipeline/string-to-long
{
  "description": "convert RepeatCount field from string into long",
    "processors": [      
      {
        "convert": {
          "field": "RepeatCount",
          "type": "long",
          "ignore_missing": true
        }
      }
    ]
}

Next, run the POST command reindex the old index into the new one, while running the pipeline for conversion:

POST _reindex 
{ 
   "source": { 
      "index": "fwlogs-2019.02.01" 
   }, 
   "dest": { 
      "index": "fwlogs-2019.02.01-v2", 
      "pipeline": "string-to-long"
   } 
}

If there are multiple indices, it’s recommended to use a shell script to deal with the individual index systematically, such as “fwlogs-2019.02.01”, “fwlogs-2019.02.02”, etc.

#!/bin/sh
# The list of index names in rlist.txt file
LIST=`cat rlist.txt`
for index in $LIST; do
  curl -HContent-Type:application/json --user elastic:password -XPOST https://mysearch.domain.net:9200/_reindex?pretty -d'{
    "source": {
      "index": "'$index'"
    },
    "dest": {
      "index": "'$index'-v2",
      "pipeline": "string-to-long"
    }
  }'
done

Finally, clean up the old indices by deleting them. It’s a temptation to use Kibana to DELETE fwlogs-2019.02*, but beware the new indices have the suffix “-v2” and it will be deleted if the wildcard argument is used. Instead use the shell script to delete based on the names specifically listed in the txt file.

#!/bin/sh
# The list of index names in rlist.txt file
LIST=`cat rlist.txt`
for index in $LIST; do
  curl --user elastic:password -XDELETE "https://mysearch.domain.net:9200/$index"
done
Are the Russian (Hackers) Still Coming?

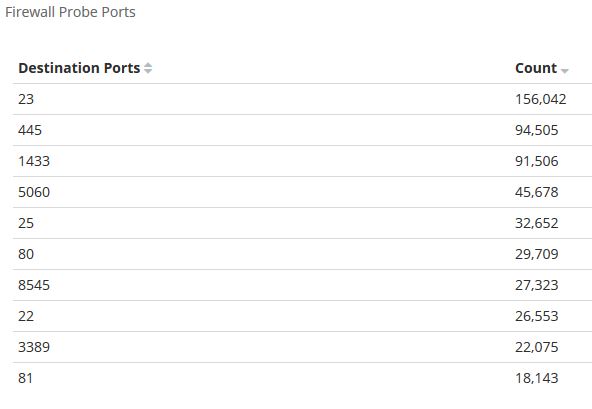
The headlines in the news these days are about hackers attempting to infiltrate sites, mostly from Russia or China. The targets are many American sites, both government and private. How does IT Cybersecurity folks know if they’re coming? Going through the application logs for all attempts is a start. However, the best source of knowledge is the first line of defense: the Firewall. So it’s best to have a tool like Elasticsearch to make a readable report on the firewall logs, to figure out which ports are being probed.

It’s imperative any exposed ports are being denied on the firewall side to prevent any successful hack. In a real world example, in the past 7 days, the hackers were scanning for popular vulnerable applications such as telnet, RDP (Windows Remote Desktop), Microsoft SQL, or SMTP.

Thankfully, those ports are being blocked on the firewall. Unfortunately, this does not deter them from trying again and again. Network and system admins must put in the due diligence in controlling access and patching applications. No matter the business requirements, security must take precedence and IT Professionals must have the tools to detect, analyze, and protect.

Recovering Kibana After Upgrade

Kibana

Elastic is doing rapid development with Elasticsearch. As of this writing, they’re now on version 6.5.3 – when 6.5.2 was released less than 2 weeks ago!  Luckily, with a package install from repo (such as RPM on CentOS/RHEL), the upgrade process to minor versions is less painful.  However, it’s not without its pitfall. For example, an  upgrade from version 6.4.x to the latest 6.5.x could lead to Kibana not able to start due to incompatible indices.

In order to alleviate this, shutdown the Kibana service, and instruct Elasticsearch to perform a recovery on the .kibana index:

curl --user elasticuser:userpassword -s https://search.mydomain.net:9200/.kibana/_recovery?pretty

If it’s connected to a big cluster with a lot of shards, speed up the recovery process without using replicas:

curl --user elasticuser:userpassword -H 'Content-Type: application/json' -XPUT 'https://search.mydomain.net:9200/.kibana/_settings' -d '{ "index" : { "number_of_replicas" : 0 } }'

Give it a few minutes (depending how much data is there) and then start up Kibana service.  If, for some reason, it still takes a long time, there may be a problem with the migration process.  The kibana.log may indicate something like this:

{“type”:”log”,”@timestamp”:”2018-12-12T17:17:40Z”,”tags”:[“warning”,”stats-collection”],”pid”:15141,”message”:”Unable to fetch data from kibana_settings collector”}
{“type”:”log”,”@timestamp”:”2018-12-12T17:17:42Z”,”tags”:[“reporting”,”warning”],”pid”:15141,”message”:”Enabling the Chromium sandbox provides an additional layer of protection.”}
{“type”:”log”,”@timestamp”:”2018-12-12T17:17:42Z”,”tags”:[“info”,”migrations”],”pid”:15141,”message”:”Creating index .kibana_2.”}
{“type”:”log”,”@timestamp”:”2018-12-12T17:17:44Z”,”tags”:[“warning”,”migrations”],”pid”:15141,”message”:”Another Kibana instance appears to be migrating the index. Waiting for that migration to complete. If no other Kibana instance is attempting migrations, you can get past this message by deleting index .kibana_2 and restarting Kibana.”}

Shutdown Kibana again, and delete the .kibana_2 index:

curl --user elasticuser:userpassword -XDELETE https://search.mydomain.net:9200/.kibana_2

Start the Kibana service again and give it a few more minutes to perform house-keeping.  Kibana should be up and running now.