Tag Archives: elastic

Can Anyone Get Rich from Open Source?

Open Source Initiative Logo

Can any company make money from Open Source?  The idea of open source work is like charity – it’s a great service for the community, but it won’t make anyone rich like Bill Gates, Steve Jobs, or Larry Ellison.  That thought may be right and wrong.

One example was MySQL. It was not capable of beating, or even competing, with Oracle Database.  However, it was the cheaper (free) solution to run web sites for bloggers (like this one) or SMBs. Since then, Oracle decided to buy MySQL’s Innobase engine because of the large install base. The same with Java which was once touted by Sun Microsystems as the ideal platform for Enterprise open-source language, was acquired by default when the Oracle bought Sun. No doubt, Larry Ellison had a thought that with this many users, there was a potential revenue to be made.

A decade ago, there was a speculation that an open source operating system like Linux is a possible money maker.  Back then, enterprise customers were still mostly invested in Solaris (Sparc) and Windows (x86) OS.  Red Hat was the biggest name in Linux distribution, and they were making money from providing support for it.  Now, IBM saw the Linux adoption kept going up, so it was only logical for IBM to acquire Red Hat, and the growing customer base along with it.

Linux adoption became bigger when Microsoft decided to include Linux as part of Windows 10 distribution, and contributed a large chunk of their code as open source.  The thinking is that contributing to vibrant and open community brings a sort of likeability to giants like Microsoft.  It’s no surprise Microsoft is touted to be a better technology innovator than Apple, Samsung, IBM, or even Google.

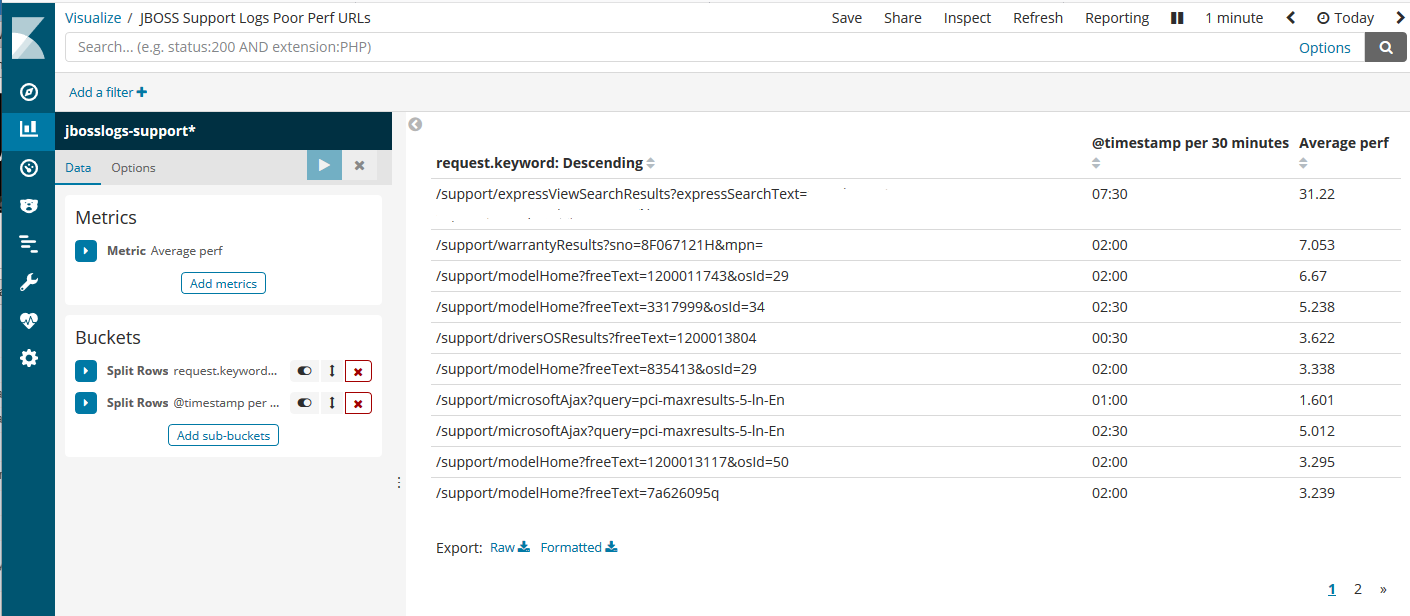
Speaking of likeability, or “coolness” factor, another example is Elastic offering a solid product based on Lucene open source search engine. With customers like Uber and SpaceX adopting their (based-on) open source search engine, Elastic is poised to make plenty of revenue.  So much so, they’re gaining competition from Amazon Web Services offering the same solution based on Elasticsearch open source software. The potential revenue is definitely available for the taking.

Can anyone get rich from Open Source?  Absolutely.  As long as there are mass adoptions, rich use cases, growing libraries, and plenty of community experts, open source is now becoming the standard for technology adoption in Enterprise environments.  The most successful companies will succeed in the open source game, only if they can make a compelling product that works really well and be able to support it. The customers are there – just make them happy!

[EDIT 8/1/2019]: Wired has a nice write-up on how companies should take the “moral” ground and mutual benefits when it comes to licensing open source software. My thought this can be tricky because of the old saying: “It’s just business, nothing personal.” Although it’s nice that we expect people to play nice, making money is a dirty business.

Are the Russian (Hackers) Still Coming?

The headlines in the news these days are about hackers attempting to infiltrate sites, mostly from Russia or China. The targets are many American sites, both government and private. How does IT Cybersecurity folks know if they’re coming? Going through the application logs for all attempts is a start. However, the best source of knowledge is the first line of defense: the Firewall. So it’s best to have a tool like Elasticsearch to make a readable report on the firewall logs, to figure out which ports are being probed.

It’s imperative any exposed ports are being denied on the firewall side to prevent any successful hack. In a real world example, in the past 7 days, the hackers were scanning for popular vulnerable applications such as telnet, RDP (Windows Remote Desktop), Microsoft SQL, or SMTP.

Thankfully, those ports are being blocked on the firewall. Unfortunately, this does not deter them from trying again and again. Network and system admins must put in the due diligence in controlling access and patching applications. No matter the business requirements, security must take precedence and IT Professionals must have the tools to detect, analyze, and protect.

Elasticsearch Logo

Using Elasticsearch for JBOSS Logs

Elasticsearch Logo

Ever since the GSA been decommissioned, there seems to be one clear winner as a replacement:  Elasticsearch.  The search engine software is also quite powerful and versatile.  It can be adapted to do customized site searches, or use the ready-made tools to ingest logs from Apache web servers, or others like systems data, network packets, and even Oracle databases.  Best of all, it’s based on open-source software (Apache Lucene) and the functional basic version is free to use!

Naturally, as part of a sysadmin job, being able to analyze logs and have it searchable and visualized (in Kibana) will make the job easier. For Enterprise environments that use JBOSS EAP as an app container, one can use Elasticsearch to parse through the logs, both historical and in real-time.  The tools are:

From the search engine itself, to the individual tools, there are a lot of information on the Elastic site on how to configure and run them, including examples.  It is assumed Elasticsearch and Kibana have been configured and running, and Logstash and Filebeat have been setup.  The purpose of this post is only to show the possibility of parsing through JBOSS logs.

When JBOSS logs are enabled, use Filebeat to read through all of the access_log files using a wildcard. Filebeat is a lightweight (written in Go) application that can sit on the JBOSS or Web servers, and not interfere with the current operations.  It’s ideal for production environments.  The filebeat.yml file looks something like this:

filebeat.inputs:
- type: log
  enabled: true
  paths:
  - /apps/jboss-home/standalone/log/default-host/access_log_*
tags: ["support"]
output.logstash:
    hosts: ["logstash-hostname:5044"]

Filebeat has a nifty feature that continues to read a log file as it is appended.  However, be warned, if the log file gets truncated (deleted or re-written), then Filebeat may erroneously  send partial messages to Logstash, and will cause parsing failures.

In Logstash, all the Filebeat input will now need to parsed for the relevant data to be ingested into Elasticsearch.  This is the heart of the ingestion process, as Logstash is the place where the data transformation is happening.   A configuration file in the /etc/logstash/conf.d directory looks like this:

input {
   beats {
   port => 5044
   }
}

filter {
 if "beats_input_codec_plain_applied" in [tags] {
    mutate {
       remove_tag => ["beats_input_codec_plain_applied"]
    }
 }

grok {
   match => {
"message" => '%{IPORHOST:clientip} %{USER:ident} %{USER:auth} [%{HTTPDATE:timestamp}] "%{WORD:verb} %{DATA:request} HTTP/%{NUMBER:httpversion}" %{NUMBER:response:int} (?:-|%{NUMBER:bytes:int}) (?:-|%{NUMBER:perf:float})'
   }
}

date {
    match => [ "timestamp", "dd/MMM/YYYY:HH:mm:ss Z" ]
    locale => en
    remove_field => "timestamp"
}

mutate {
    remove_field => [ "message", "@version", "[beat][version]", "[beat][name]", "[beat][hostname]" ]
   }
}

output {
   if "support" in [tags] {
      elasticsearch {
        hosts => ["elasticsearch-hostname:9200"]
        manage_template => false
        index => "jbosslogs-support-%{+YYYY.MM.dd}"

      }
}

Logstash listens on port 5044, on the same (or separate) server as Elasticsearch.  When ingesting a lot of data, both Logstash and Elasticsearch engines (Java based apps) will consume quite a bit of CPU and Memory, so it’s a good idea to separate them.

In this example, a JBOSS access_log entry is something like:

192.168.0.0 – – [09/Nov/2018:15:50:16 -0800] “GET /support/warrantyResults HTTP/1.1” 200 77 0.002

The most important number is the last field, which is a floating-point value for the URL execution time (in seconds).  It’s assigned to a field name “perf”, as in performance.  Kibana can be used to gather/visualize the perf values and see if there’s any issue with the JBOSS application.

Kibana Snapshot

The above screenshot indicates the top few URLs with average performance times above 3 seconds.  The timestamp column shows the time it happened during the timespan selected (in this example, “today”).  Then just zoom into the specific time and troubleshoot the Java app, accordingly.

This is just one way to dive into the JBOSS logs using Elasticsearch and Kibana. An Elastic engineer can spend hours creating and tweaking this setup in order to get the most of the available data. At least the tools are friendly enough to configure, with plenty of documentation available on their website.  The software has been around long enough, with plenty of community support, that searching the forums (via Google) can give helpful hints for the customization effort.  In general, this is an impressive (and fun) way to perform log analysis.  For the price, it’s quite impressive. No wonder Elastic’s IPO raised over $250 million on the first day!  They’re on the right track to be the next hot company with products Enterprise customers can really use.