Using AWK To Manipulate Apache HTTPD Log Entries

GNU Awk

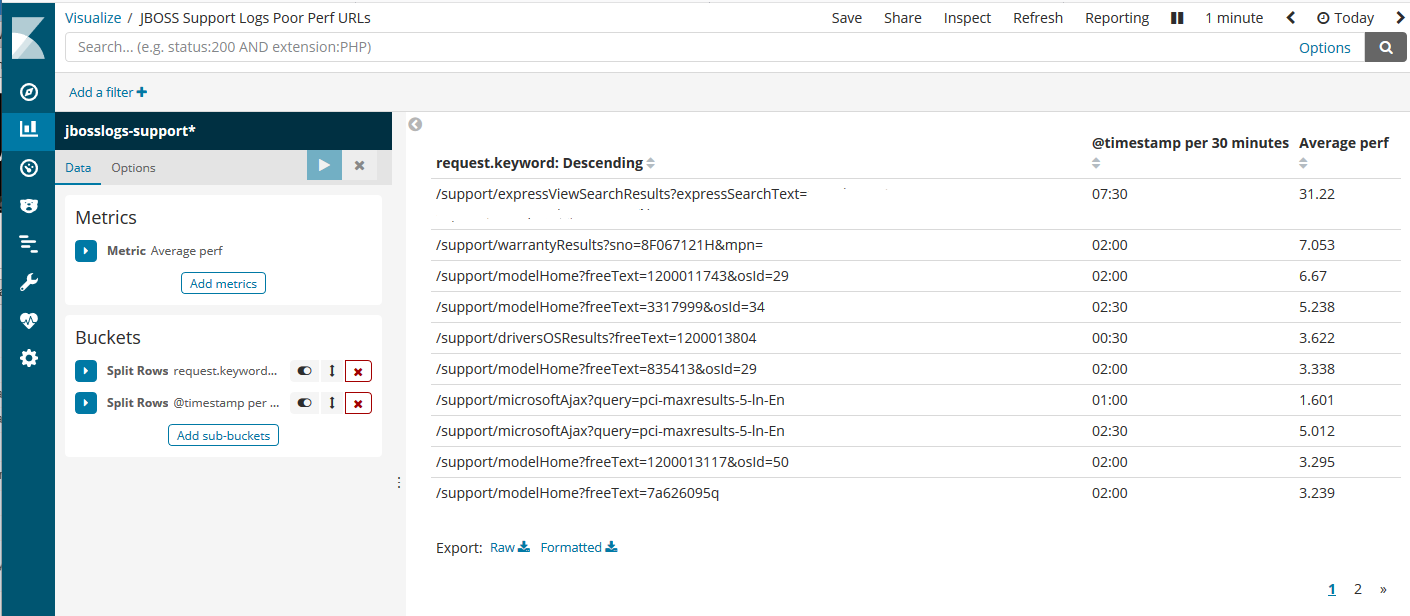
The Apache web server (HTTPD) logs are full of useful information. One method to data mine the Apache logs is using command line programs such as grep and AWK to do exact counts if certain occurrences (ie. 404 errors).  A more recent tool that’s extremely useful is Elasticsearch.  Using logstash, the logs are fed into, and indexed into Elasticsearch engine, so the data can be easily discovered/visualized via Kibana.

An interesting issue encountered in an Enterprise production environment is through the use of a load balancer (LB) and/or web application firewall (WAF).  The resulting Apache logs are not reporting the correct client source IP addresses.  The logs would show the load balancer IP address – which is not useful for customer profiling/marketing purposes.

192.168.0.2 – – [19/Nov/2018:00:00:12 -0800] “GET /images/support/frontend/toshiba-200.png HTTP/1.1” 200 5237 “https://support.toshiba.com/support/staticContentDetail” “Mozilla/5.0 (Windows NT 6.1; WOW64) AppleWebKit/537.36 (KHTML, like Gecko) Chrome/66.0.3359.117 Safari/537.36” “139.130.4.5, 192.168.0.1”

In this example, 192.168.0.1 is the IP address of the LB and 192.168.0.2 is for the WAF.  The LB, in this case, can not automatically report to the WAF the actual client source IP, so it had to do it via X-Forwarded-For HTTP header. The way this LB is configured, last entry in each line of the log has the pair value (in quotes) of the source and LB IP addresses.

As shown it’s possible to parse through logs using Logstash and Filebeat. Similarly, it can be done for Apache web logs.  In this case, however, some data clean-up is needed so the default Apache2 logstash grok filter can be used.  AWK is the command line tool of choice.  First breakdown the fields and merge quoted fields as one field:

function merge_fields(start, stop) {
    #printf "Merge fields $%d to $%d\n", start, stop;
    if (start >= stop)
        return;
    merged = "";
    for (i = start; i <= stop; i++) {
        if (merged)
            merged = merged OFS $i;
        else
            merged = $i;
    }
    $start = merged;

    offs = stop - start;
    for (i = start + 1; i <= NF; i++) {
        #printf "$%d = $%d\n", i, i+offs;
        $i = $(i + offs);
    }
    NF -= offs;
}

# Merge quoted fields together.
{
    start = stop = 0;
    for (i = 1; i <= NF; i++) {
        if (match($i, /^"/))
            start = i;
        if (match($i, /"$/))
            stop = i;
        if (start && stop && stop > start) {
            merge_fields(start, stop);
            # Start again from the beginning.
            i = 0;
            start = stop = 0;
        }
    }
}

Then just pick and choose what fields to display, in the order that’s grok-able by the logstash Apache2 plugin:

{
    gsub("\"","",$11); split($11,ipaddr,"\,"); printf "%s", ipaddr[1];
    for (i = 2; i <= 10; i++) {
        printf " %s", $i;
    }
    printf "\n";
}

EDIT: Note the output of printf needs to be clean, with no extra spaces. Otherwise, logstash’s grokfilter will not be able to parse properly!

The “gsub” AWK function is a global search and replace, used to remove the quotes out of the 11th field that contains a quoted pair of IP addresses.  Using the “split” function, the comma separated values can now be assigned into an array “ipaddr”. As the source client IP address, take the first value in the array.

Finally, just feed the entire access_log file into this AWK script as a pipeline, then send the output into a local file for filebeat to pick up, or remotely to logstash.

Important Note: This AWK script will not detect any inconsistent pattern other than what’s already assumed above.  For example, if the X-Forwarded-For IP values are not provided, then nothing will be generated in the source IP output. Thus, producing a grok parse failure in Logstash.  To avoid this, use “grep -v” to exclude any of those anomalies – as well as other keywords that need not be tracked, such as LB health checks, etc.

Moving the Default Docker Data Directory in RHEL 7

Red Hat Docker

In every application, the install directory is set to defaults such as /var, /opt, or /usr/local (even the / root directory) for data and logs.  This is fine for testing purposes. However, for production use, especially when the application becomes really active, those data and log directories can be big.  An alternate storage location, such as LVM or xfs, will be needed that can re-sized for future expansion.

In this example, let’s perform the requirement to move Docker’s default directory into a separate xfs formatted disk. For Red Hat Enterprise Linux 7 installation, this Docker setup is off the RPM repository.  The default is /var/lib/docker for the data files.  In order to change the path into somewhere else, for example /disk2/docker, first change the /etc/sysconfig/docker file to reflect the change:

OPTIONS=’–selinux-enabled –log-driver=journald –signature-verification=false –graph=/disk2/docker –iptables=False –storage-driver=overlay2′

Move the files from /var/lib/docker into the new /disk2/docker directory.  Since SELinux is enabled for production environment, Docker will need the permission to write into the new directory:

semanage fcontext -a -s system_u -t container_var_lib_t ‘/disk2/docker(/.)?’

semanage fcontext -a -s system_u -t container_share_t ‘/disk2/docker/./config.env’

semanage fcontext -a -s system_u -t container_file_t ‘/disk2/docker/vfs(/.)?’semanage fcontext -a -s system_u -t container_share_t ‘/disk2/docker/init(/.)?’

semanage fcontext -a -s system_u -t container_share_t ‘/disk2/docker/overlay(/.)?’semanage fcontext -a -s system_u -t container_share_t ‘/disk2/docker/overlay2(/.)?’

semanage fcontext -a -s system_u -t container_share_t ‘/disk2/docker/containers/./hosts’semanage fcontext -a -s system_u -t container_log_t ‘/disk2/docker/containers/./..log’

semanage fcontext -a -s system_u -t container_share_t ‘/disk2/docker/containers/./hostname’

And finally, restore the file context for /disk2/docker:

restorecon -R /disk2/docker

Start up the Docker service again, and the environment is now ready to use!

Elasticsearch Logo

Using Elasticsearch for JBOSS Logs

Elasticsearch Logo

Ever since the GSA been decommissioned, there seems to be one clear winner as a replacement:  Elasticsearch.  The search engine software is also quite powerful and versatile.  It can be adapted to do customized site searches, or use the ready-made tools to ingest logs from Apache web servers, or others like systems data, network packets, and even Oracle databases.  Best of all, it’s based on open-source software (Apache Lucene) and the functional basic version is free to use!

Naturally, as part of a sysadmin job, being able to analyze logs and have it searchable and visualized (in Kibana) will make the job easier. For Enterprise environments that use JBOSS EAP as an app container, one can use Elasticsearch to parse through the logs, both historical and in real-time.  The tools are:

From the search engine itself, to the individual tools, there are a lot of information on the Elastic site on how to configure and run them, including examples.  It is assumed Elasticsearch and Kibana have been configured and running, and Logstash and Filebeat have been setup.  The purpose of this post is only to show the possibility of parsing through JBOSS logs.

When JBOSS logs are enabled, use Filebeat to read through all of the access_log files using a wildcard. Filebeat is a lightweight (written in Go) application that can sit on the JBOSS or Web servers, and not interfere with the current operations.  It’s ideal for production environments.  The filebeat.yml file looks something like this:

filebeat.inputs:
- type: log
  enabled: true
  paths:
  - /apps/jboss-home/standalone/log/default-host/access_log_*
tags: ["support"]
output.logstash:
    hosts: ["logstash-hostname:5044"]

Filebeat has a nifty feature that continues to read a log file as it is appended.  However, be warned, if the log file gets truncated (deleted or re-written), then Filebeat may erroneously  send partial messages to Logstash, and will cause parsing failures.

In Logstash, all the Filebeat input will now need to parsed for the relevant data to be ingested into Elasticsearch.  This is the heart of the ingestion process, as Logstash is the place where the data transformation is happening.   A configuration file in the /etc/logstash/conf.d directory looks like this:

input {
   beats {
   port => 5044
   }
}

filter {
 if "beats_input_codec_plain_applied" in [tags] {
    mutate {
       remove_tag => ["beats_input_codec_plain_applied"]
    }
 }

grok {
   match => {
"message" => '%{IPORHOST:clientip} %{USER:ident} %{USER:auth} [%{HTTPDATE:timestamp}] "%{WORD:verb} %{DATA:request} HTTP/%{NUMBER:httpversion}" %{NUMBER:response:int} (?:-|%{NUMBER:bytes:int}) (?:-|%{NUMBER:perf:float})'
   }
}

date {
    match => [ "timestamp", "dd/MMM/YYYY:HH:mm:ss Z" ]
    locale => en
    remove_field => "timestamp"
}

mutate {
    remove_field => [ "message", "@version", "[beat][version]", "[beat][name]", "[beat][hostname]" ]
   }
}

output {
   if "support" in [tags] {
      elasticsearch {
        hosts => ["elasticsearch-hostname:9200"]
        manage_template => false
        index => "jbosslogs-support-%{+YYYY.MM.dd}"

      }
}

Logstash listens on port 5044, on the same (or separate) server as Elasticsearch.  When ingesting a lot of data, both Logstash and Elasticsearch engines (Java based apps) will consume quite a bit of CPU and Memory, so it’s a good idea to separate them.

In this example, a JBOSS access_log entry is something like:

192.168.0.0 – – [09/Nov/2018:15:50:16 -0800] “GET /support/warrantyResults HTTP/1.1” 200 77 0.002

The most important number is the last field, which is a floating-point value for the URL execution time (in seconds).  It’s assigned to a field name “perf”, as in performance.  Kibana can be used to gather/visualize the perf values and see if there’s any issue with the JBOSS application.

Kibana Snapshot

The above screenshot indicates the top few URLs with average performance times above 3 seconds.  The timestamp column shows the time it happened during the timespan selected (in this example, “today”).  Then just zoom into the specific time and troubleshoot the Java app, accordingly.

This is just one way to dive into the JBOSS logs using Elasticsearch and Kibana. An Elastic engineer can spend hours creating and tweaking this setup in order to get the most of the available data. At least the tools are friendly enough to configure, with plenty of documentation available on their website.  The software has been around long enough, with plenty of community support, that searching the forums (via Google) can give helpful hints for the customization effort.  In general, this is an impressive (and fun) way to perform log analysis.  For the price, it’s quite impressive. No wonder Elastic’s IPO raised over $250 million on the first day!  They’re on the right track to be the next hot company with products Enterprise customers can really use.